About These Figures
Each figure shows the seasonal cycle of a satellite-derived environmental variable — sea surface temperature (SST) or chlorophyll a — within a selected region for a single year, plotted against the full multi-decadal climatology. These plots provide environmental context for the regional Calanus finmarchicus biomass and sentinel zooplankton indicators presented elsewhere on this site. SST tracks the thermal habitat that sets metabolic rates, developmental timing, and species ranges; chlorophyll a is a proxy for phytoplankton biomass and serves as a first-order indicator of food available to grazing copepods.
Data Source
Chlorophyll a. ESA Ocean Colour Climate Change Initiative (OC-CCI) version 6 daily Level-3 product, ~4 km spatial resolution, 1998–present. OC-CCI is a multi-sensor merged product (SeaWiFS, MODIS-Aqua, MERIS, VIIRS, OLCI) bias-corrected to a common reference, providing a consistent long-term record suitable for trend and climatology analysis. Distributed via the NOAA NEFSC ERDDAP server.
Sea Surface Temperature. NOAA Optimum Interpolation SST (OISST) v2.1, daily 0.25° resolution, 1982–present (Huang et al. 2021). OISST blends in situ buoy and ship observations with AVHRR and other satellite radiances to produce a gap-free analysis. Distributed via the NOAA CoastWatch ERDDAP server.
Regional Environmental Indices
The satellite data are high-resolution gridded products — the figures here distill them into place-based seasonal indices designed to track year-to-year change and provide historical context for any given observation. Two complementary spatial frameworks are used:
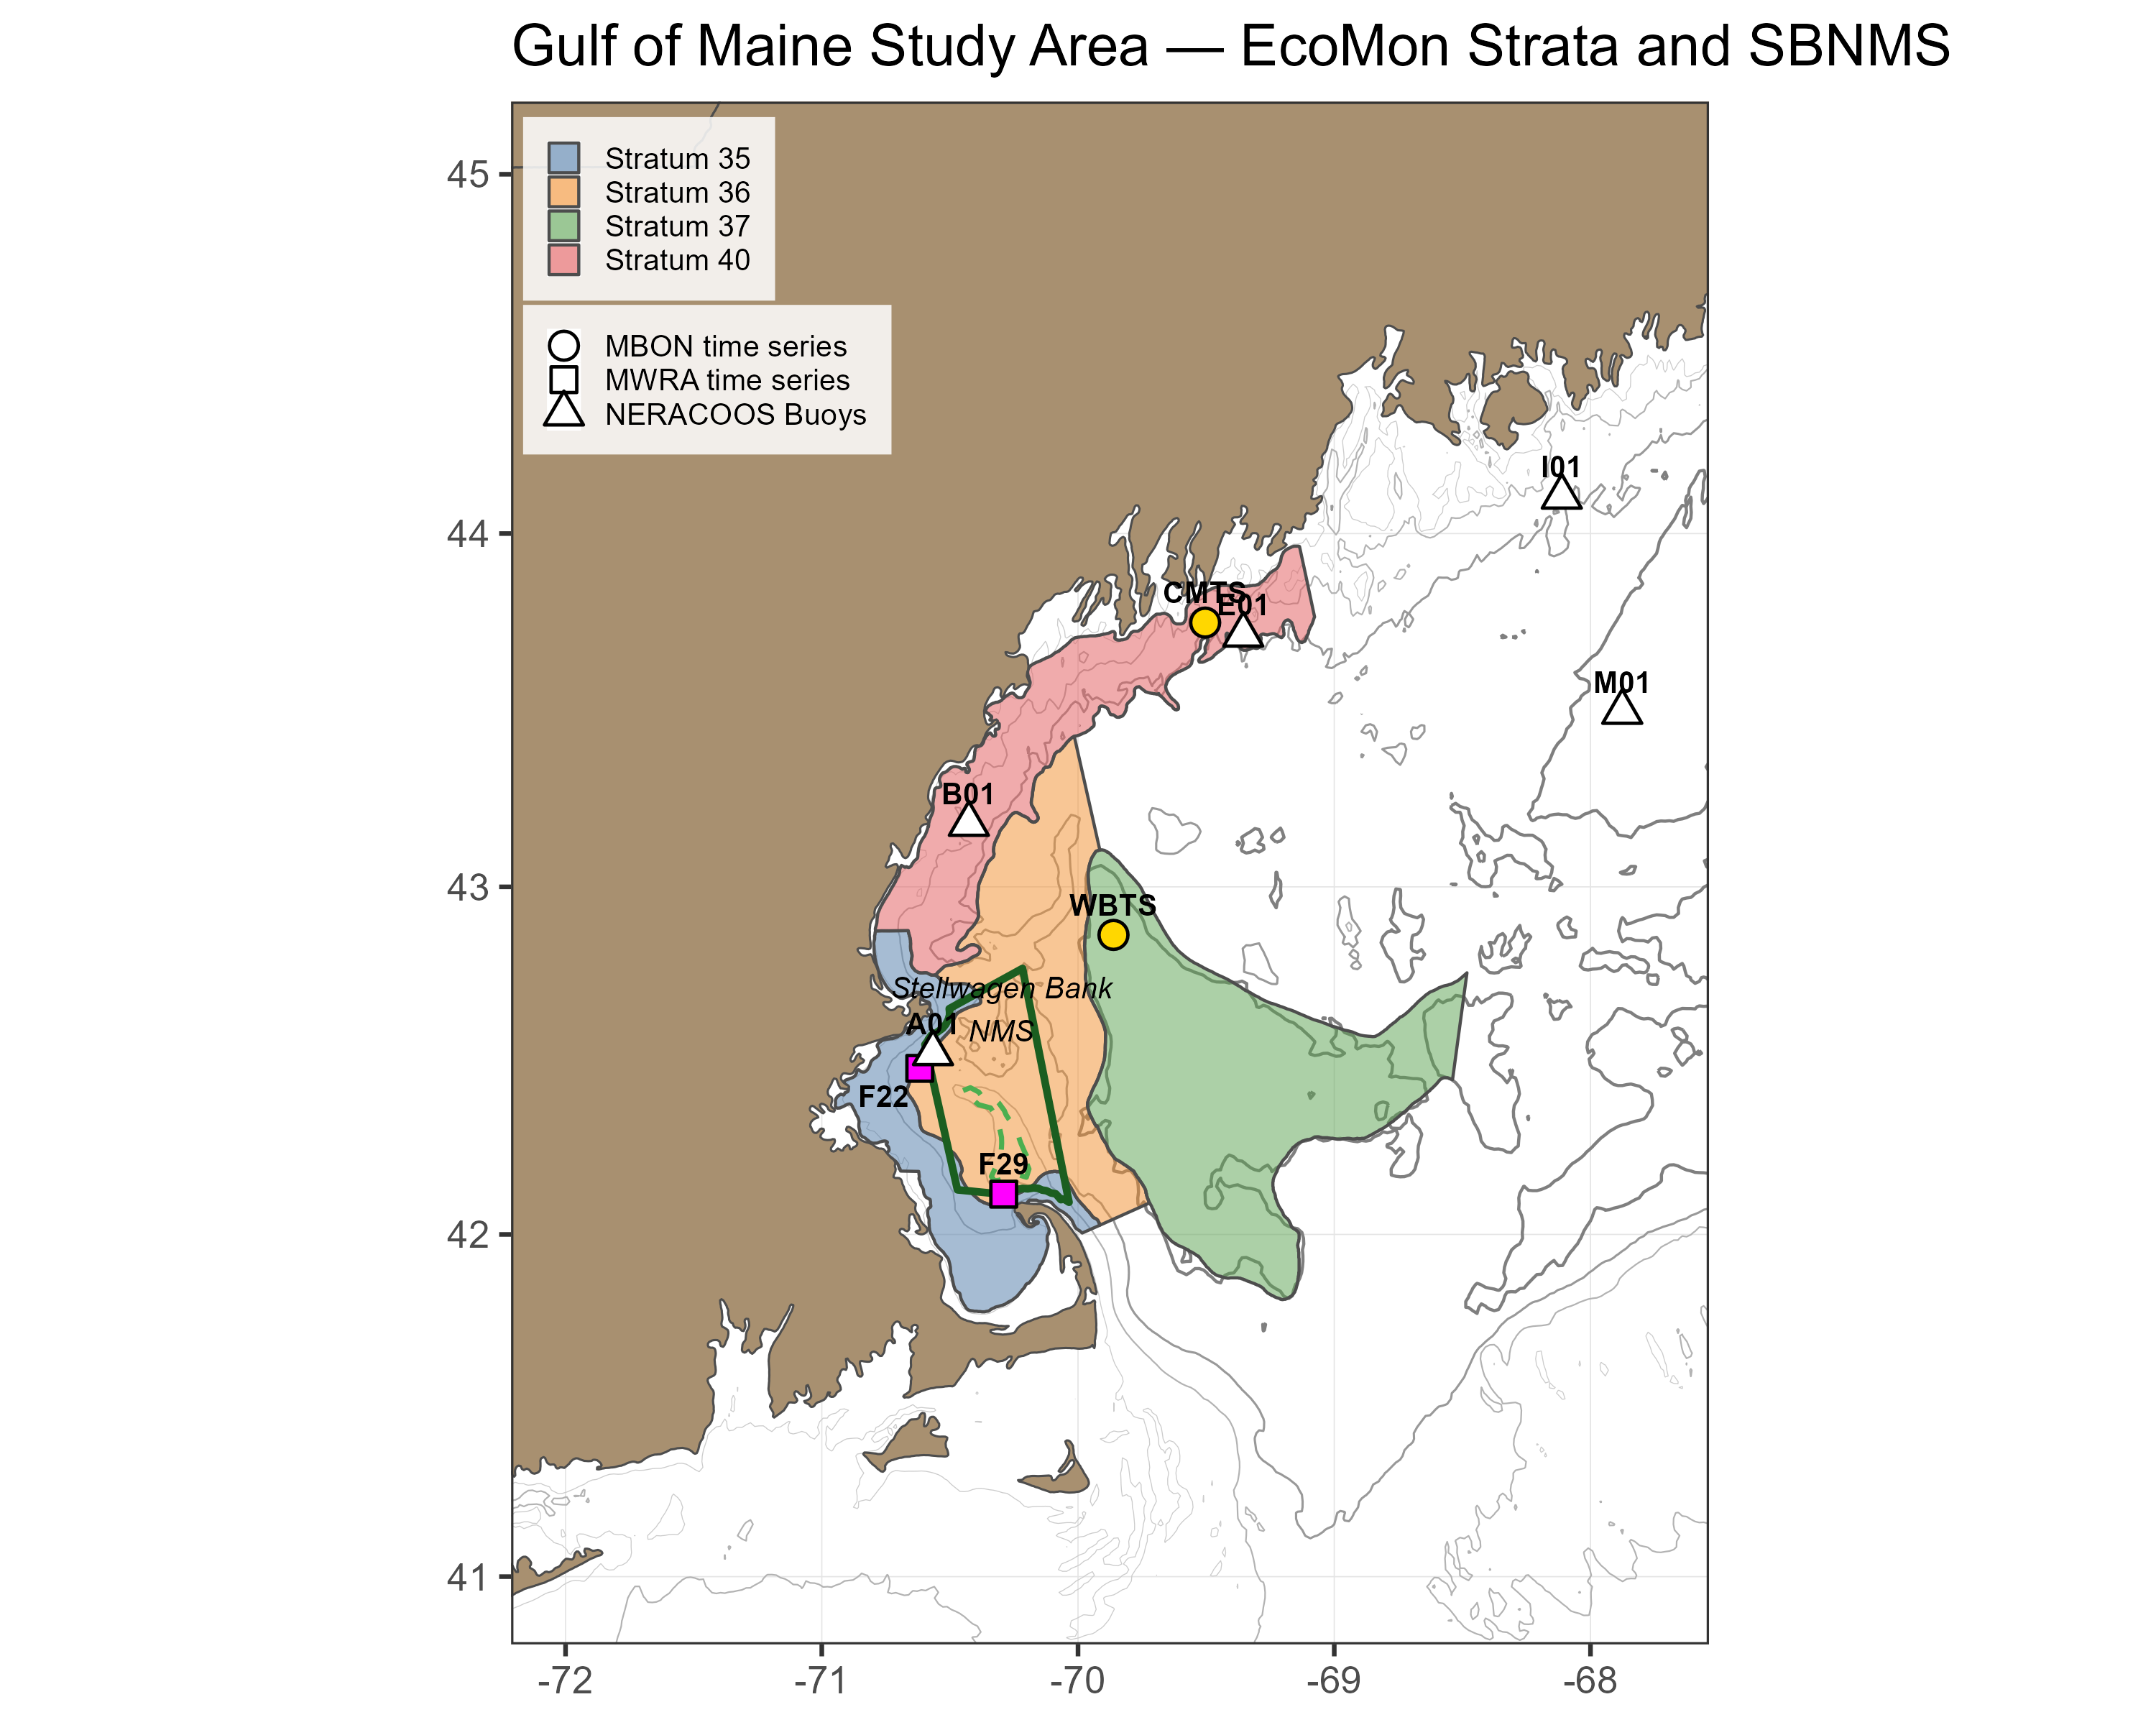
Observation Area Polygons. The CPO viewer footprint covers the Stellwagen Bank National Marine Sanctuary (SBNMS) and the four adjacent NOAA EcoMon survey strata (35, 36, 37, 40) that bracket the southwestern Gulf of Maine, Massachusetts Bay, and the Great South Channel. These are the same polygons used for the Calanus finmarchicus biomass aggregation, so satellite indicators can be compared directly against modeled biomass within the same footprint.
Time Series Stations. Two Gulf of Maine Marine Biodiversity Observation Network (MBON) stations operated by NERACOOS are included for environmental context: the Wilkinson Basin Time Series Station (WBTS) in the western Gulf of Maine, and the Coastal Maine Time Series Station (CMTS) in the northern coastal Gulf of Maine. A 5 km buffer around each station coordinate is used as the satellite extraction footprint. The 5 km buffer was chosen so that buffers remain entirely offshore while still covering a small cluster of OC-CCI pixels per station for stable polygon means. These are the same stations featured in the Sentinel Zooplankton Indicators viewer, and together with the SBNMS / EcoMon polygons they trace the southwestward-flowing Maine Coastal Current pathway that connects coastal production to offshore foraging habitat.
Within each polygon or buffer, daily satellite values are aggregated into 8-day composites following the MODIS standard window convention (46 windows per year, starting on day-of-year 1, 9, 17, …). For chlorophyll a on the larger polygons (SBNMS and the EcoMon strata), native 4 km OC-CCI pixels are first averaged into ~12 km blocks to give equal weight to each sub-area and mitigate bias toward systematically cloud-clear regions; chlorophyll at the 5 km station buffers is kept on the native 4 km grid, and SST is kept on its native 0.25° grid throughout. Per-window uncertainty is reported as the pooled standard deviation across all (block × day) observations within the polygon during the 8-day window, capturing both within-day spatial heterogeneity (differences among blocks on the same day) and between-day temporal variability (drift of the polygon mean across the window’s cloud-free days).
How to Read the Plot
| Element | Meaning |
|---|---|
| Light grey ribbon | Full historical range across all years (climatological min/max) |
| Dark grey ribbon | Climatological mean ± 1 SD across years |
| Dashed grey line | Climatological 8-day mean |
| Coloured line + error bars | Selected focus year (green for chlorophyll a, blue for SST); error bars show the 8-day pooled SD across all (block × day) observations inside the polygon |
The maximum and total pixels observed for the year are annotated on the figure. Windows are flagged as “sparse” when fewer than a minimum number of valid pixel-days contribute to the composite, in which case no value is shown for that window. Plots are marked “Sparse data” when the selected year has insufficient pixel coverage across the season.
References
Sathyendranath, S., Brewin, R.J., Brockmann, C., Brotas, V., Calton, B., Chuprin, A., Cipollini, P., Couto, A.B., Dingle, J., Doerffer, R. and Donlon, C., 2019. An ocean-colour time series for use in climate studies: the experience of the ocean-colour climate change initiative (OC-CCI). Sensors, 19(19), p.4285.
Huang, B., Liu, C., Banzon, V., Freeman, E., Graham, G., Hankins, B., Smith, T. and Zhang, H.M., 2021. Improvements of the daily optimum interpolation sea surface temperature (DOISST) version 2.1. Journal of Climate, 34(8), pp.2923–2939.
Runge, J.A., Thompson, C.R., Shellito, S., Dullaert, E.C., Honda, I.A., Vandemark, D., Pugh, D., Young-Morse, R., Motyka, J., Jones, R.J. and Boss, L.K., 2025. Zooplankton monitoring at fixed station time series records responses of the foundation species, Calanus finmarchicus, to seasonal and multiannual drivers in the western Gulf of Maine. ICES Journal of Marine Science, 82(4), p.fsaf037.